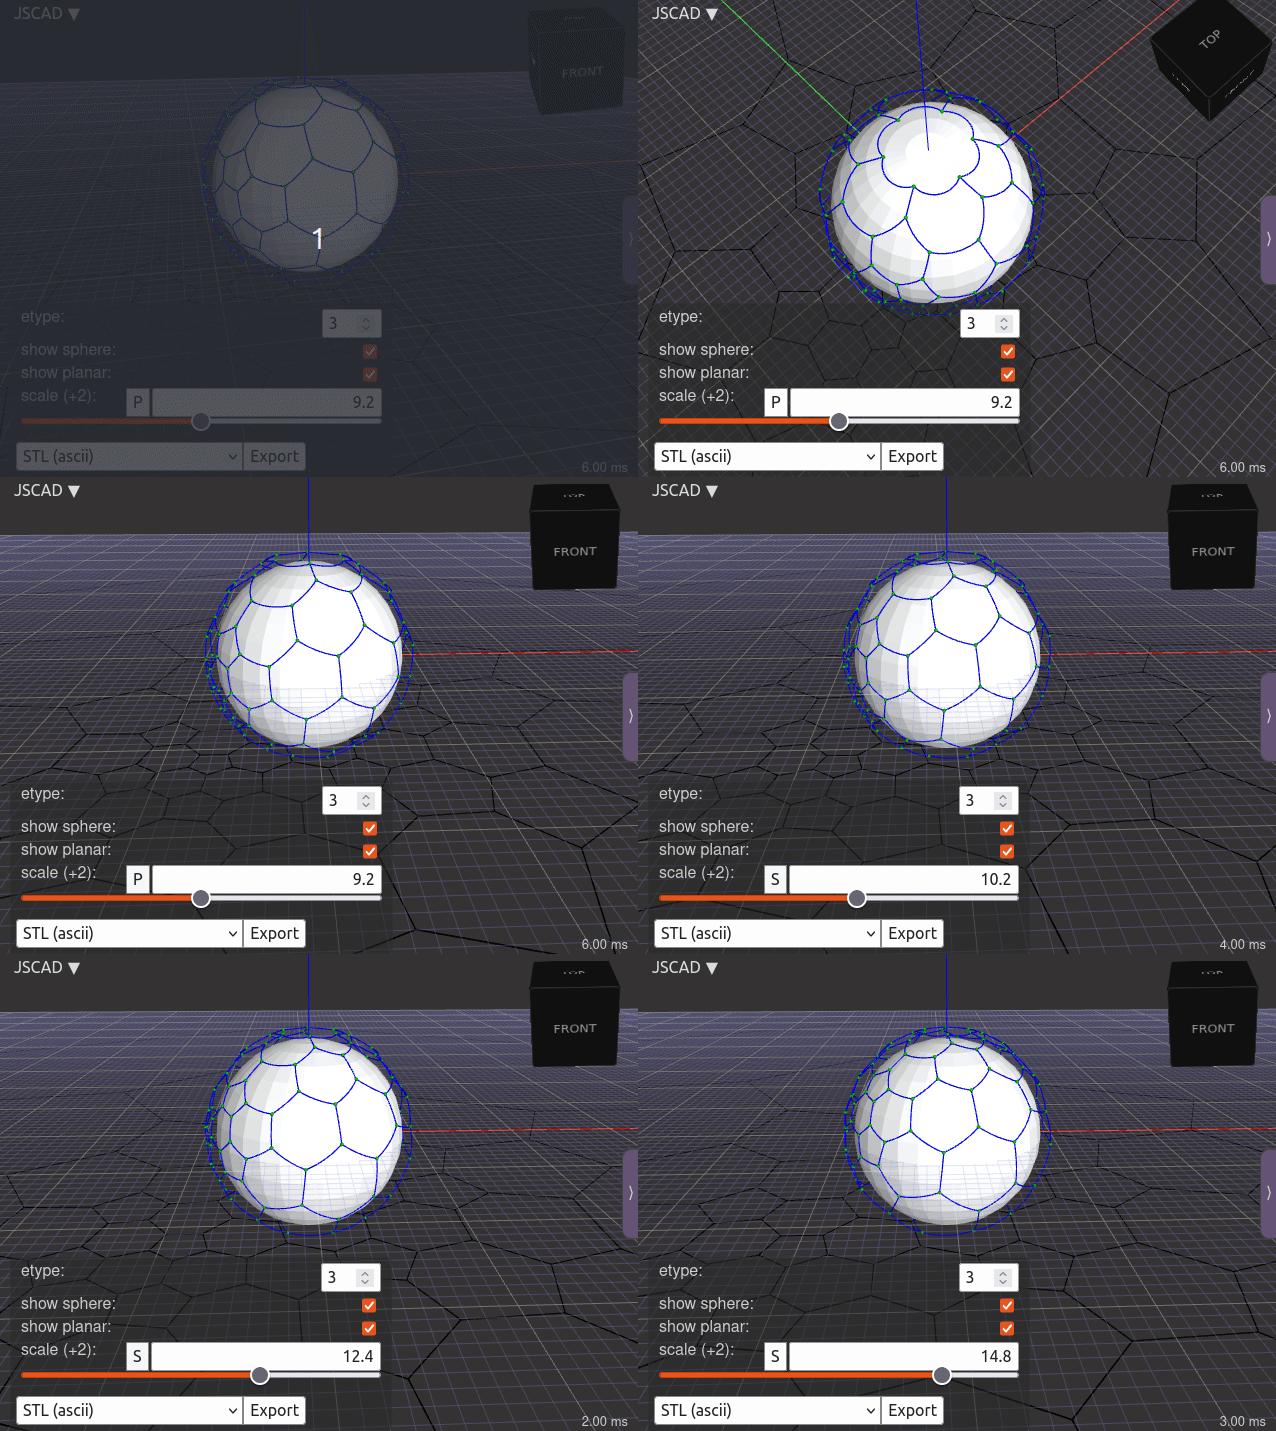
Port to JSCAD is complete, and animation slider allows to nicely see the changes for different Tutte embedding (black bottom) scale factors for stereosgraphic projection onto sphere:
![Image]()
You get to this view by selecting a graph, and clicking on "stereographic projection" button on this page:
https://hermann-sw.github.io/planar_graph_playground/
It was really easy to pass the graph and coordinates of Tutte embedding from HTML page to JSCAD app:
Quite some progress, now need to think how to get a "Tutte like" equilibrium on sphere. Perhaps by flipping the edges that do not break planarity (eg. topmost edges) from "spherical circle" (etype=3) arc to "great circle arc" (etype=2).
The very first graph mp7 is example for an edge that needs etype=3:
With etype=2 the edge produces an edge crossing ...

You get to this view by selecting a graph, and clicking on "stereographic projection" button on this page:
https://hermann-sw.github.io/planar_graph_playground/
It was really easy to pass the graph and coordinates of Tutte embedding from HTML page to JSCAD app:
- I stored needed constant part of script in multiline string (template literal) "jscad" in HTML page
https://github.com/Hermann-SW/planar_gr ... js#L8-L227 - When the SVG has been created, the parameters are stored in variable "params":
https://github.com/Hermann-SW/planar_gr ... #L341-L344Code:
params = "coords = " + JSON.stringify(coords_) + "\n" + "adj = " + JSON.stringify(to_adjacency_lists(G)) + "\n"; - the transfer to jscad.app is done with button's onclick method, into browser tab:
Code:
javascript:window.open('https:///jscad.app/#data:application/json,'+encodeURIComponent(params+jscad),'_spherical_embedding')
Quite some progress, now need to think how to get a "Tutte like" equilibrium on sphere. Perhaps by flipping the edges that do not break planarity (eg. topmost edges) from "spherical circle" (etype=3) arc to "great circle arc" (etype=2).
The very first graph mp7 is example for an edge that needs etype=3:
With etype=2 the edge produces an edge crossing ...
Statistics: Posted by HermannSW — Sun Sep 15, 2024 8:17 pm